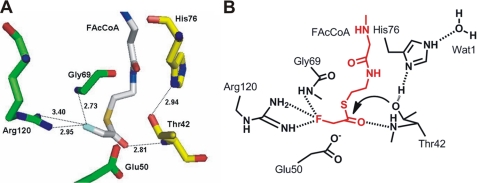
FIGURE 5.
Proposed FAcCoA coordination at the active site of FlK. A, a stick model with FAcCoA shown in silver and residues from the two protomers represented in yellow and green colors, respectively. B, a scheme with FAcCoA (red) and active site residues (black). Hydrogen bonding interactions are denoted by dotted lines with distance in Å.

