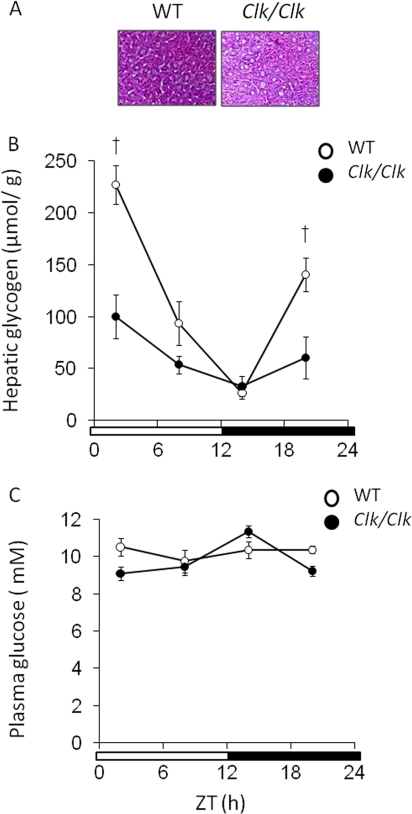
FIGURE 3.
Clock mutation damps circadian variation of hepatic glycogen contents. The mice were maintained under a 12 h of light/12 h of dark cycle (lights on at 0:00 and lights off at 12:00). Open and closed symbols, wild-type (WT) and Clock mutant mice, respectively. A, periodic acid-Schiff's staining of liver sampled at ZT 2 of wild-type mice and Clock mutant mice (n = 3). B, hepatic glycogen contents in wild-type mice and Clock mutant mice were measured at indicated times. The values are the means ± S.E. (n = 8). C, plasma glucose concentrations. The values are the means ± S.E. (n = 8). The significant differences compared with values from wild-type mice at each time point are indicated. †, p < 0.01. The p values were calculated using Student's t test.

