FIGURE 9.
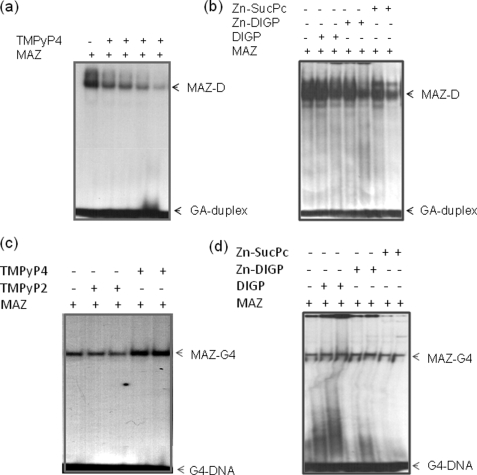
Effect of G4-DNA ligands on KRAS transcription. a, an EMSA shows that the complex between GA-duplex and MAZ-GST is competed by increasing amounts of TMPyP4 (0.5, 1, 2, and 5 μm). Duplex concentration is 20 nm, and MAZ is 4 μg (5% PAGE in TBE). b, shown is the same experiment as in a but with phthalocyanines DIGP, Zn-DIGP, and Zn-SucPc at concentrations 5 and 10 μm. c, an EMSA show that the KRAS G-quadruplex binds to MAZ-GST in the absence and presence of TMPyP2 or TMPyP4 (2.5 and 10 μm), 10% PAGE in TBE. d, shown is the same experiment as in c but phthalocyanines DIGP, Zn-DIGP, and Zn-SucPc at the concentrations of 5 and 10 μm. The streaking in the second, third, and fifth lanes from the left is due to the effect of phthalocyanines binding to the quadruplex.

