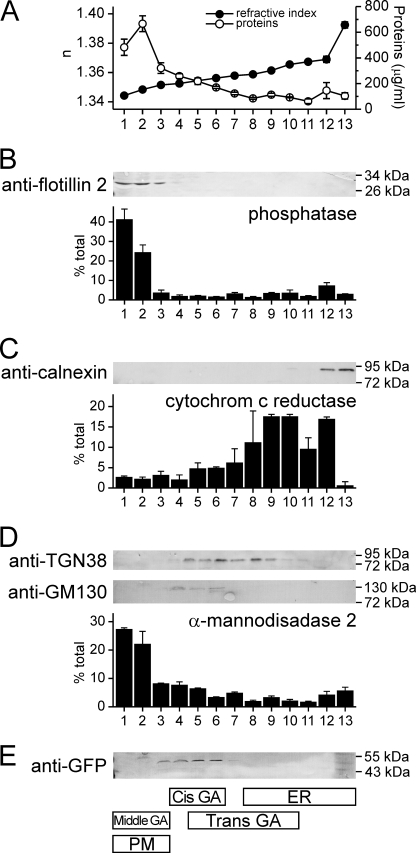
FIGURE 7.
Subcellular distribution of EqtII-GFP. Cell lysate of NIH 3T3 fibroblasts expressing EqtII-GFP was fractionated by centrifugation on a discontinuous Optiprep gradient and the resulting fractions were immunoblotted and assayed for enzyme activities as indicated. The value in a particular fraction is expressed as percentage to the sum of the enzyme activity in all fractions. Average ± S.D. is shown of two independent fractionations. A, refraction index (solid circles) was measured to check the gradient. Protein content (open circles) was measured by using Bradford reagent. B, markers for plasma membrane (flotillin-2 and K+-(p-nitrophenyl phosphatase)). C, markers for ER (calnexin and cytochrome c reductase). D, markers for GA (TGN38, GM130 and mannosidase II). E, Eqt-GFP. The summary of distribution of various markers presented in B–D is shown below schematically.

