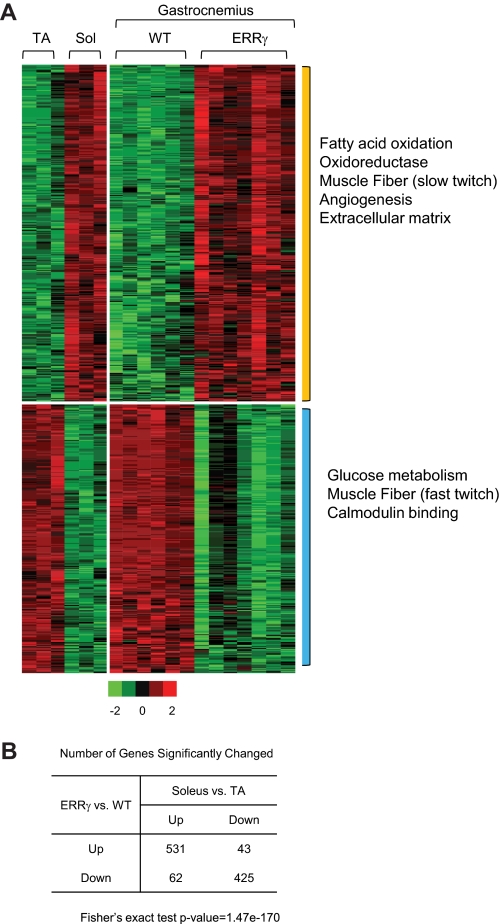
FIGURE 4.
Gene expression profile of ERRγ transgenic muscle is similar to that of type I oxidative muscle. A, heat map representing the coordinate gene expression pathways in tibialis anterior (TA) and soleus (Sol) (left panel) and wild type (WT) and VP16ERRγ transgenic (right panel) gastrocnemius muscle. Each individual column within the heat map represents a single mouse subject (n = 3 each for the soleus and tibialis anterior, n = 6 for WT and 7 for TG mice). The expression values are standardized within the data sets. Red color means up-regulation; green is down-regulation, and black is no change. The color scale is represented in Fig. 5A. The significantly over-represented GO terms by each group of genes is marked on the right. The p values used to determine significance for the individual genes are as follows: p < 0.01 for TG versus WT and p < 0.05 for soleus versus tibialis anterior. B, table represents the number of genes significantly changed in both datasets. The p value of Fisher's exact test is 1.47e-170 for the null hypothesis that the genes regulated by VP16ERRγ are unrelated to those differentially expressed between soleus and tibialis anterior (TA) muscle.

