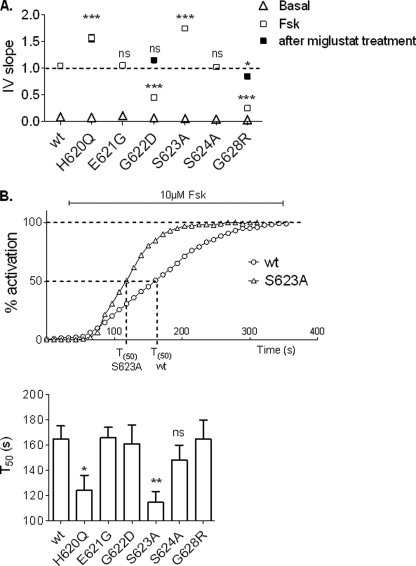
FIGURE 5.
Analysis of the global Fsk-activated Cl− currents recorded for each CFTR mutant. A, I/V slope of current/voltage relationships. Dotted line corresponds to the wt level. B, upper, representatives time course of wt and S623A mutant in the presence of 10 μm Fsk. Lower, histograms representing mean of time (s) to reach 50% activation for each mutant. ns, nonsignificant difference; *, p < 0.05; **, p < 0.01; ***, p < 0.001 compared with wt. Error bars, S.E.

