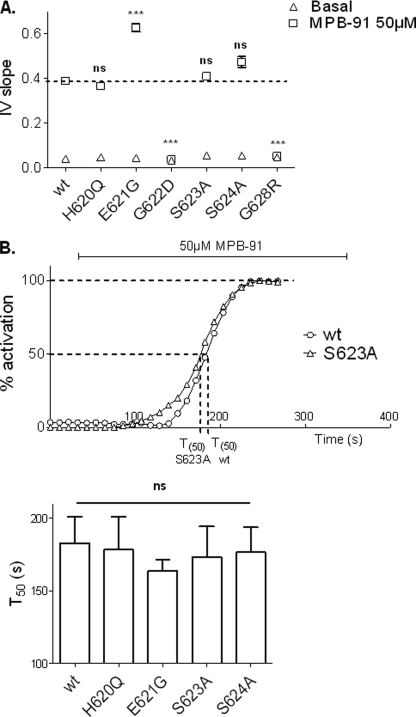
FIGURE 7.
Analysis of the global MPB-activated Cl− currents recorded for each CFTR mutant. A, I/V slope of current/voltage relationships. Dotted line corresponds to the wt level. B, upper, representatives time course of wt and S623A mutant in presence of 50 μm MPB-91. Lower, histograms representing the mean of time corresponding to 50% of activation for each mutant. ns, nonsignificant difference. ***, p < 0.001 compared with wt. Error bars, S.E.

