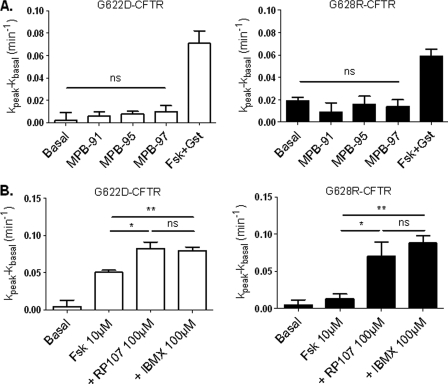
FIGURE 9.
Iodide efflux of G622D and G628R CFTR-expressing cells in the presence of different MPB compounds or different activators. A, bar chart showing iodide efflux in BHK-21-transfected cells stimulated by 10 μm Fsk + 30 μm genistein (Gst) or 100 μm MPBs. n = 4 for each. B, bar chart showing iodide efflux in BHK-21-transfected cells stimulated by 10 μm Fsk, 10 μm Fsk + 100 μm RP-107, or 10 μm Fsk + 100 μm isobutylmethylxanthine (IBMX). n = 4 for each. ns, nonsignificant difference; *, p < 0.05; **, p < 0.01. Error bars, S.E.

