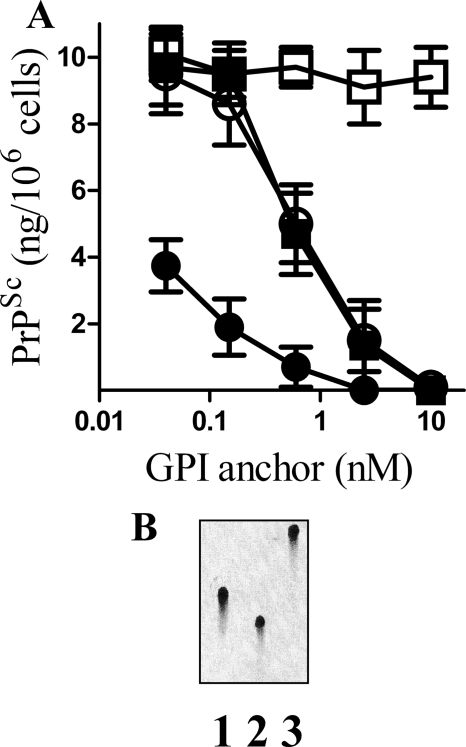
FIGURE 9.
Specific GPI anchors reduced PrPSc formation in ScGT1 cells. A, amount of PrPSc in ScGT1 cells treated for 7 days with varying concentrations of GPI anchors isolated from PrPC (●), Thy-1 (○), CD55 (■), or an anchorless control (□). Values shown are the mean average amount of PrPSc (ng/106 cells) ± S.D., n = 15. B, HPTLC analysis of GPI anchors isolated from PrPC (lane 1), Thy-1 (lane 2), or CD55 (lane 3).

