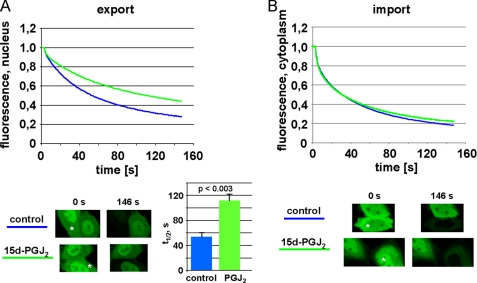
FIGURE 5.
FLIP analysis of export inhibition by 15d-PGJ2. Cells were transfected with a plasmid coding for NES-GFP2-M9 and subjected to FLIP-analysis in the presence of 15 μm 15d-PGJ2 or ethanol as a control. The graphs show the mean of three (A, export) or two (B, import) independent experiments, analyzing 10–20 cells each. Error bars are omitted for clarity (see supplemental Fig. S3 for the original data set of a single experiment). A, a region in the cytoplasm was bleached to analyze loss of fluorescence from the nucleus, i.e. nuclear export. The bar graph shows t½, i.e. the time it takes to loose 50% of the nuclear fluorescence. The bars indicate the standard deviation from the mean of three independent experiments. B, a region in the nucleus was bleached to analyze loss of fluorescence from the cytoplasm, i.e. nuclear import. Single cells before the first (t = 0 s) and after the last (t = 146 s) bleach interval are depicted. Asterisks indicate the bleached compartments. Note that in the ethanol control (A) the bleached cell looses the vast majority of its fluorescence, indicating efficient export. The 15d-PGJ2-treated cell, by contrast, retains a significant level of fluorescence in the nucleus, indicating inhibited export.

