FIGURE 7.
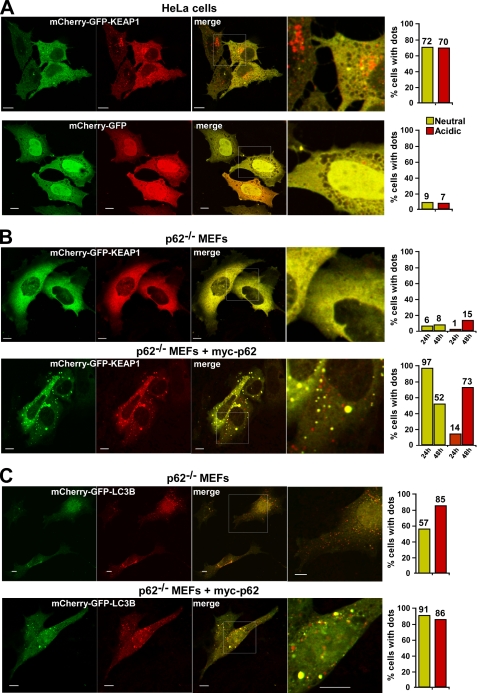
Overexpressed KEAP1 accumulates in acidic vesicles. A, HeLa cells transfected with mCherry-GFP-KEAP1 or mCherry-GFP were analyzed by confocal microscopy 24 h after transfection. The fraction of cells with mCherry-GFP-KEAP1 in neutral dots (green and red) and acidic dots (only red) was counted, and the result of a representative experiment based on counting of >300 transfected cells is shown to the right. B, p62−/− MEFs transfected with mCherry-GFP-KEAP1, either alone or together with Myc-p62, were analyzed by confocal microscopy 24 and 48 h after transfection. C, p62−/− MEFs transfected with mCherry-GFP-LC3B, either alone or together with Myc-p62, were analyzed by confocal microscopy 24 h after transfection. To the right is shown quantifications of the percentage of cells with neutral or acidic dots for representative experiments, each based on counting of more than 150 transfected cells. In A–C, bars represent 10 μm.

