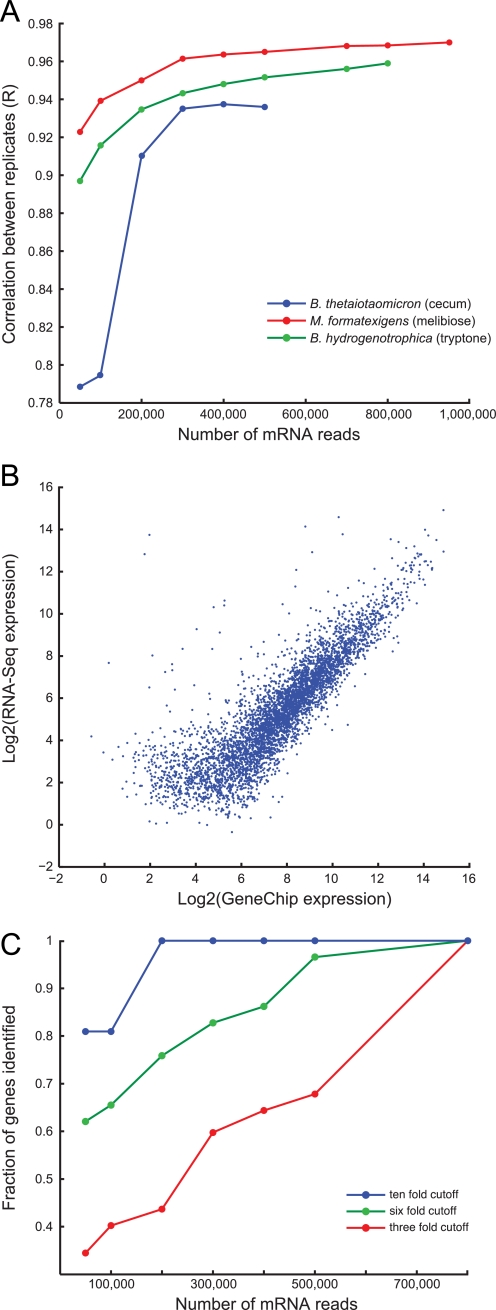
FIGURE 1.
Validation of microbial RNA-Seq. A, the correlation between biological replicates at different sequencing depths reached an asymptote above 0.9 for in vivo samples (blue circles, B. thetaiotaomicron in cecum) and in vitro samples (red circles, M. formatexigens grown on MBf medium with melibiose as a carbon source; green circles, B. hydrogenotrophica grown on MA4 medium with tryptone as a carbon source). B, mRNA abundances for RNA samples prepared from the ceca of B. thetaiotaomicron mono-associated mice (n = 4 samples from 4 animals) were highly correlated (r = 0.86) between Affymetrix GeneChip and RNA-Seq platforms. Comparable results were also found for bi-associations of B. thetaiotaomicron with B. hydrogenotrophica and M. formatexigens (n = 5 replicates each). Most of the discrepancies between the two methods involved transcripts detected at higher levels by RNA-Seq compared with GeneChip. C, the sequencing depth required to detect differential gene expression for microbial community members at different relative abundances was estimated by calculating the overlap between the fraction of genes differentially expressed at a given fold change threshold for a complete sample (M. formatexigens RNA; each of two replicate cultures grown in MBf medium plus melibiose or xylose) versus subsamples of the complete sample. With 200,000 reads, all 10-fold changes were found with zero false positives (blue circles). 6- and 3-fold changes (green and red circles, respectively) required greater sequencing depths to identify >80% of the differentially expressed genes. See Figs. S4 and S5 for additional analyses.

