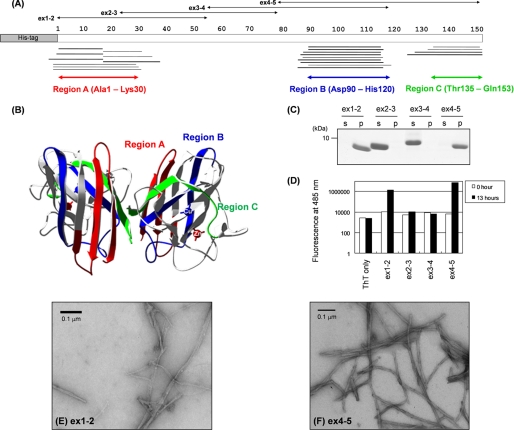
FIGURE 1.
MALDI-TOF mass spectrometric analysis of a core structure in SOD1 aggregate and experimental identification of SOD1 sequences with high aggregation propensities. A, peptides corresponding to the mass peaks detected are mapped on the primary sequence of SOD1. Numbers indicated above the primary sequence of SOD1 (shown as open bars) represent the amino residue numbers. Peptides were identified either by MS/MS analysis (thick bars) or mass (thin bars). Details of peptide identification are summarized in supplemental Table S1. B, three-dimensional structure of an SOD1 dimer with copper and zinc ions bound (Protein Data Bank code 1HL5). Regions A–C are colored red, blue, and green, respectively. C, after overnight agitation of 100 μm SOD1 fragments (ex1–2, 2–3, 3–4, and 4–5 as shown in A) at 37 °C, a sample solution was ultracentrifuged at 110,000 × g for 30 min to separate a supernatant (s) and a pellet (p) fraction, and these fractions were analyzed by a 15% SDS-polyacrylamide gel stained with Coomassie Brilliant Blue. D, fluorescence intensity was measured in the samples containing 25 μm ThT and 3 μm SOD1 fragments before (0 h, open bars) and after (13 h, filled bars) 1,200 rpm agitation at 37 °C. E and F, electron micrograms of the pellet fraction containing (E) ex1–2 and (F) ex4–5 aggregates.

