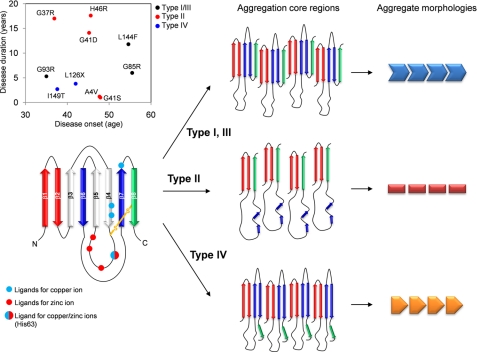
FIGURE 6.
Our proposed model to describe mutation-dependent structural polymorphism of SOD1 aggregates. In secondary structural representation of SOD1 (left), regions A–C are colored red, blue and green, respectively. Rearrangement of these regions results in the formation of a core, and at least three different combinations of interactions among regions A–C are possible (middle). An exact alignment of β-sheets in the aggregates remains unknown; therefore, alignment of regions A–C in each schematic representation (middle) is still speculative. Interactions among aggregation core regions determine overall morphologies (right) and biochemical properties of SOD1 aggregates. Inset, average disease duration is plotted against average onset of disease. Data were taken from Refs. 31, 32. Type I/III, II, and IV aggregates are colored by black, red, and blue, respectively.

