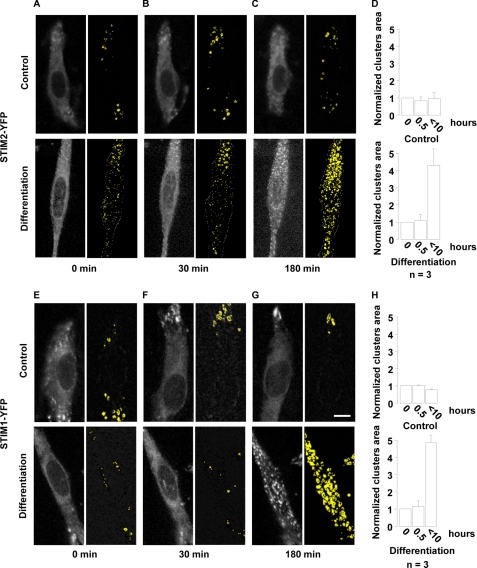
FIGURE 2.
STIM1 and STIM2 form characteristics clusters when differentiation is initiated. Myoblasts were transfected with STIM1-YFP or STIM2-YFP and kept for 2 days in proliferation medium. On the day of the experiment, live cell imaging was started in proliferation medium for 2 h and, at time = 0 min and continued in either differentiation medium or a proliferation medium containing 2 mm Ca2+ (control). The scale bar for all images (in G) represents 15 μm. In A–C: Left images: STIM2-YFP fluorescence in differentiation or proliferation (control) conditions. Right images: visualization of clusters using an automatic detection of fluorescence intensity variations called “by edges” (Metamorph 7.5.6, Molecular Devices). Clusters (STIM2-YFP clustering) are shown in yellow. D, quantification of STIM2-YFP clusters are measured in three independent experiments. Results were normalized to the area measured in proliferation conditions. E–H, same experiments as in A–D, except that STIM1-YFP was used instead of STIM2-YFP.

