
Figure 5.
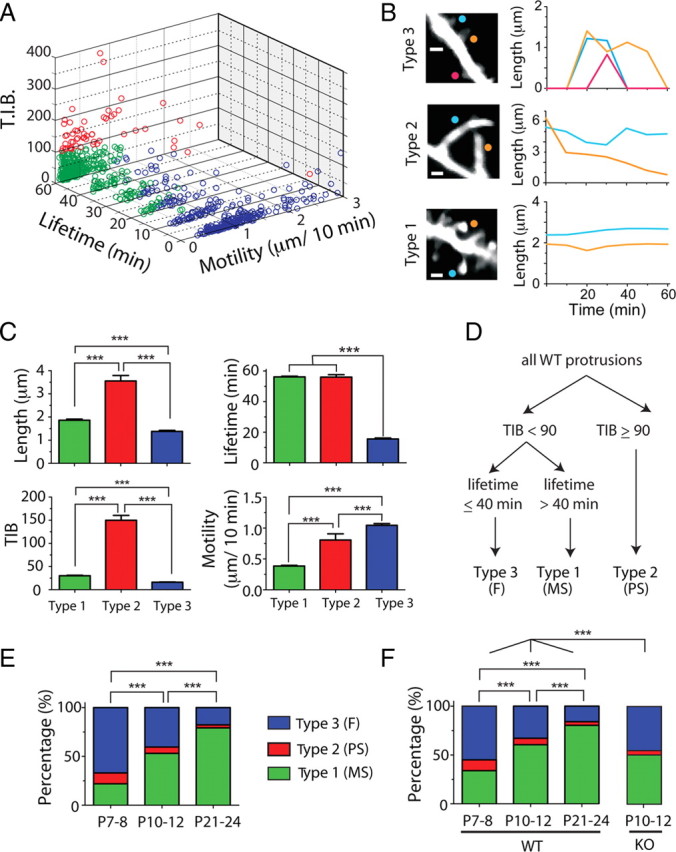
Overabundance of immature protrusion subtypes in Fmr1 KO mice. A, Cluster analysis of all WT protrusions from P7 to P24, based on lifetime, motility, and TIB (total integrated brightness of GFP). Protrusions were segregated into three groups using a k-means test in MATLAB clustering algorithm (see Materials and Methods). B, Representative examples of the three types of protrusions and their length over time in time-lapse imaging sessions. Note that type 2 protrusions are longer and brighter than the others. C, Average length, TIB, lifetime, and motility for each of the three types of protrusions. Types 1, 2, and 3 institutively fall into three well established types of protrusion: mature spines (MS), protospines (PS), and filopodia (F). ***p < 0.001, one-way ANOVA with Tukey's test in C, E, and F. D, Manual sorting of protrusions based on parameters inspired from cluster analysis. These cutoffs were then applied to the protrusions from KO mice. E, Relative abundance of individual protrusion subclasses at different postnatal ages in WT mice as determined by k-means test (includes all protrusions). F, Relative abundance of individual protrusion subclasses in WT and Fmr1 KO mice using cutoffs inspired by k-means test (A) for TIB and lifetime.