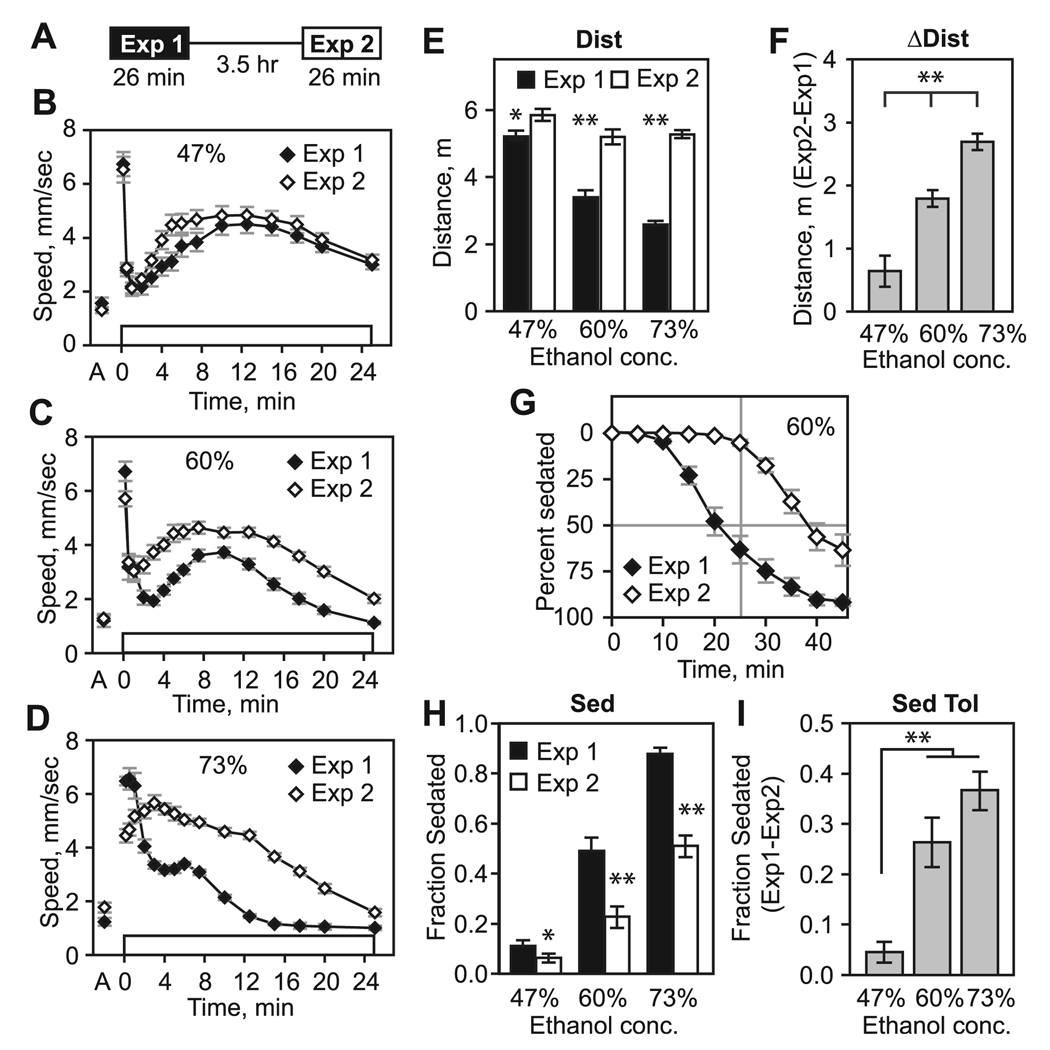
Fig. 1.
Dose-dependent alterations in ethanol-induced hyperactivity and sedation sensitivity in a rapid ethanol tolerance paradigm. (A) Exposure scheme for induction and detection of ethanol rapid tolerance. Groups of genetically identical flies are given two 26-minute exposures to ethanol vapor, separated by a 3.5-hour rest under standard culturing conditions. (B) Prior to ethanol exposure (“A” on horizontal axis) flies exhibit low levels of locomotor activity. Exposure of naive flies to a continuous stream of ethanol vapor (47% concentration, open box) results in an olfactory startle response that subsides by 1 minute, followed by a hyperactive phase from approximately 2 to 25 minutes (Exp 1). Hyperactivity declines with increasing locomotor incoordination and sedation. Following a 3.5-hour rest, flies exposed a second time to the same ethanol vapor concentration exhibit a small increase in hyperactivity during its onset (Exp 2). (C and D) Exposure to higher concentration ethanol vapor results in greater differences in the hyperactive phase between Exp 1 and Exp 2. (E) Distance traveled (Dist) from 2 to 25 minutes ethanol vapor exposure. Distance traveled was significantly greater during Exp 2 versus Exp 1 (47%: *p = 0.037, 60%: **p < 0.0005, 73%: **p < 0.0005, paired t-test, n = 15). (F) Change in distance traveled (ΔDist) between Exp 2 and Exp 1 (**p < 0.0005, ANOVA, all samples different by Tukey’s multiple comparison test). (G) Time course of ethanol sedation at 60% ethanol vapor. (H) The fraction of flies sedated (Sed) following 26-minute ethanol exposure. Fewer flies were sedated following the second ethanol exposure at all concentrations tested (47%: *p = 0.038, 60%: **p < 0.0005, 73%: **p < 0.0005, paired t-test, n = 15). (I) Sedation tolerance (Sed Tol) is the difference in the fraction of flies sedated between Exp 1 and Exp 2 (**p < 0.0005, ANOVA, 47% sample different by Tukey’s multiple comparison test).

