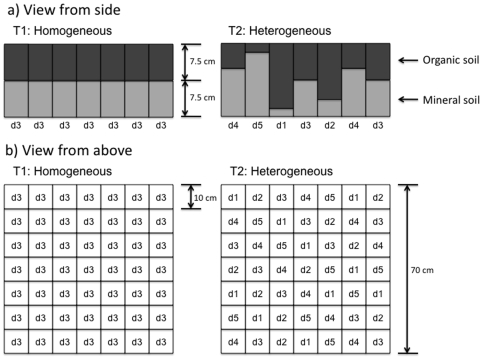
Figure 1. Schematic presentation of the experimental treatments.
a) View from the side to show the organic layer depths for both treatments representing either homogeneous or heterogeneous environment. The homogeneous treatment had the same organic (O) horizon depth (7.5 cm) throughout the box whilst the heterogeneous treatment had a mix of 5 different O-horizon depths ranging from a deep (12 cm, d1) to a shallow (3 cm, d5) O-horizon in steps of 2.25 cm increase in depth. b) View from above to show the distribution of the depths throughout each replicate. In the homogeneous treatments three cells (7.5 cm, d3) were sampled to make up one composite sample for each biotic group. In the heterogeneous treatment three cells with the same depth as the homogeneous treatment (d3) were sampled to make up one composite sample (single depth sample), and another composite sample was collected by sampling each of a cell with d1, d3 and d5 (mixed depth sample).

