
Figure 6.
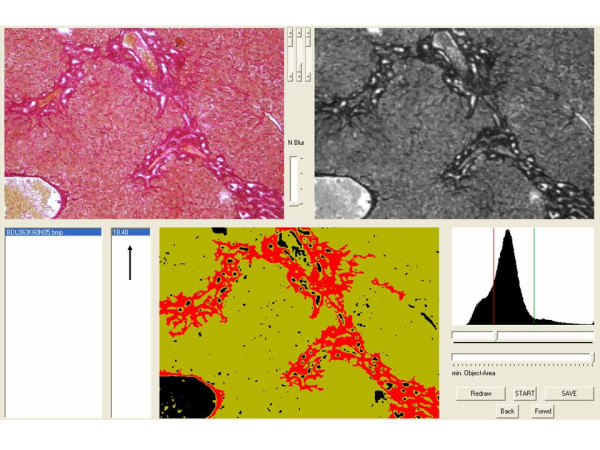
Screenshot of program interface. The original photographs are shown in the upper left corner. In the upper right corner the same picture is shown after adding the grey transformation, blurring and shading. The histogram analysis is shown in the lower right corner. The image in the lower middle shows the calculated background in black, the liver parenchyma in a light green and fibrosis intuitively red. The percentage of fibrous tissue is calculated on the lower left side (black arrow).