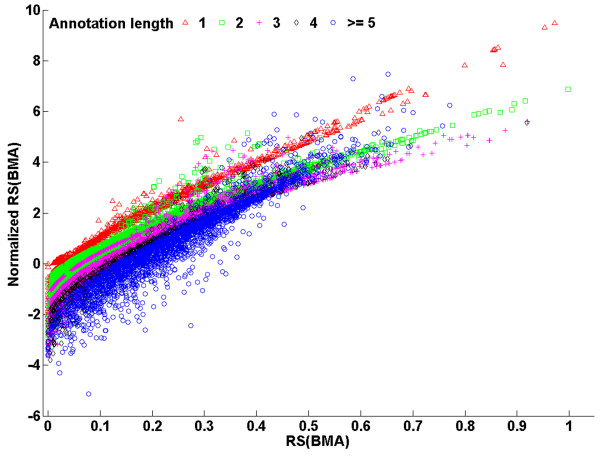
Figure 6.
Scatter plot of RS(BMA) vs. normalized RS(BMA) scores for pairs of genes in "Hematological" and "Immunological" disease categories. Disease gene pairs were classified into five groups, according to the minimum of annotation lengths of the two genes: one (red triangles), two (green squares), three (magenta plus signs), four (black diamonds) and more than four (blue circles).

