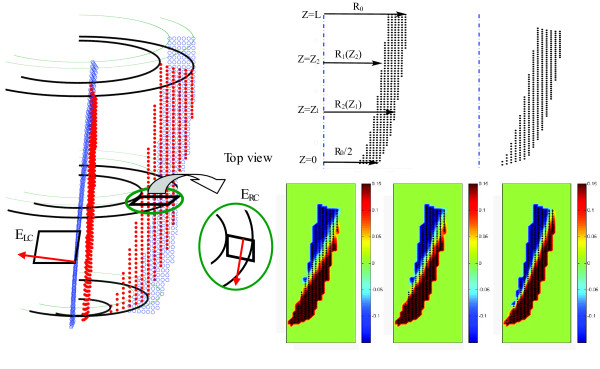
Figure 2.
(Left) Estimation of F13 and F23 using the torsion of the heart as the main factor in generating the shear strain components. Blue and red dots show the position of the myocardium before and after deformation respectively. The red vector represents the out-of-plane direction. (Right top) The geometry of the LV and related parameters are shown in the simulated data before and after deformation. R1 and R2 are the internal and external radius of the LV respectively and Z shows the longitudinal access. In this model, at Z = 0 the external radius, R2, is reduced to half compared to its value at Z = L, R0. The thickness of the myocardium is modeled as R0/4 everywhere prior to deformation. Detailed formulation of geometry and deformation are mentioned in Appendix B. (Right bottom) Three mappings of element F21 of the deformation gradient tensor F at t = 390 ms in the simulated data. F21 is calculated from the proposed algorithm with a 25 mm2 neighborhood (left map); the proposed algorithm with a 15 mm2 neighborhood (middle map); and the analytical calculations (right map). Despite similar patterns, the fast spatial changes in this quantity caused a relative RMS error of 33.5% and 26.1% in (left) and (middle) respectively, caused by smoothing.

