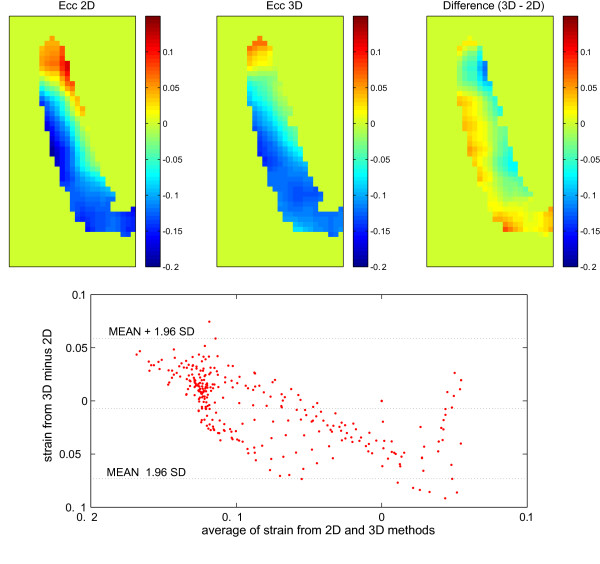
Figure 3.
The circumferential (out-of-plane) strain calculated from the proposed method (top left) in comparison to the same quantity calculated from two adjacent slices through a conventional method (top middle). The difference is shown in the top right image. The Bland-Altman plot projects the difference between these two methods in more detail (bottom). Since the measured displacement is during mid-systole, the calculated circumferential strain comprises both positive and negative values in different regions. The pattern of the strain is similar between the two methods, however, the extreme values of the strain were slightly overestimated using the proposed method.

