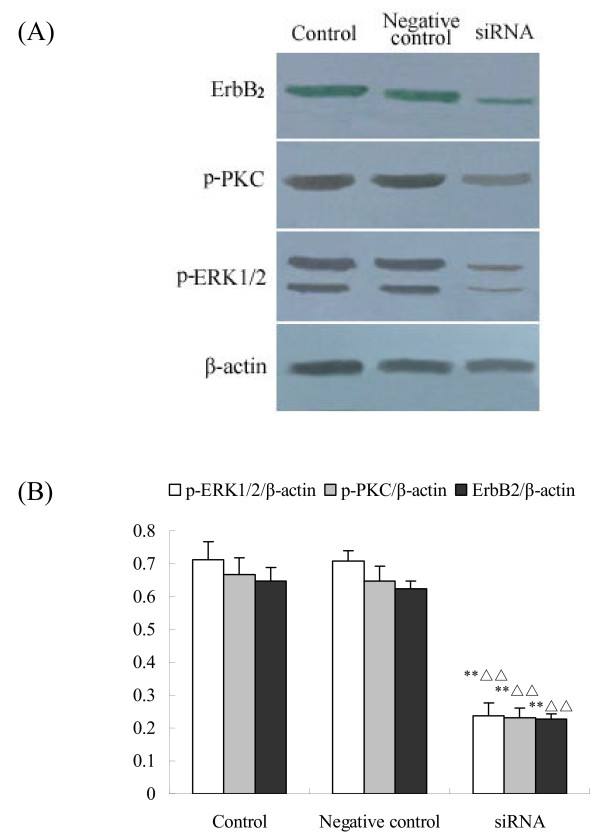
Figure 7.
Effect of c-erbB2 siRNA on the expressions of ErbB2, p-ERK and p-PKC protein. (A), The expressions of ErbB2, p-ERK and p-PKC protein in the ovaries by western blot; (B), Semiquantitative analysis of the western-blot result. Control is the group without transfection; Negetive control is the group transfected with negative control siRNA. Data are presented as means ± SEM (n = 3). **, P < 0.01 vs control group; ΔΔs, P < 0.01 vs negative control.

