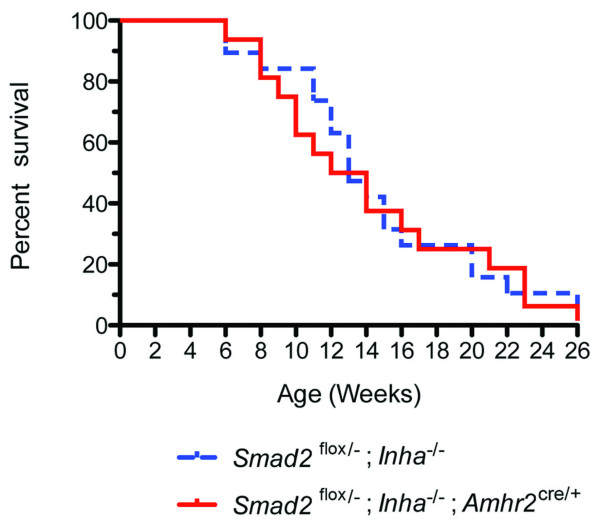
Figure 2.
Survival curve of Smad2flox/-; Inha-/- and Smad2flox/-; Inha-/-; Amhr2Cre/+ mice. The survival of the Smad2flox/-; Inha-/- (n = 19; control group) and Smad2flox/-; Inha-/-; Amhr2Cre/+ (n = 16; experimental group) mice were recorded weekly during 4 to 26 weeks. The survival curve was generated and analyzed using a Mantel-Cox test (GraphPad Software, GraphPad Prism version 5.0 b for MacOS X). Statistical significance was not found between the two groups [χ2 (1, N = 35) = 0.051, P = 0.82].

