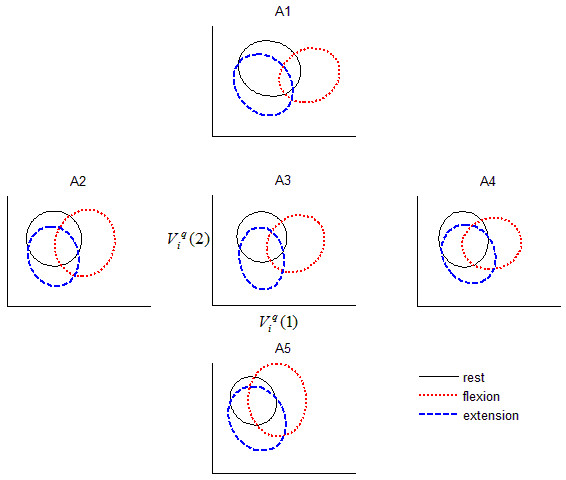
Figure 2.

Effect of accelerometer location on inter-class separation. The ellipses depict the boundaries within which 95% of the LDA-projected features lie. The projection matrix was optimized for separability using MMG signals recorded from A3. Note the increased overlap among classes once the accelerometer is positioned away from the reference location, A3. Data are shown for participant 4, trial 1.
