
Figure 3.
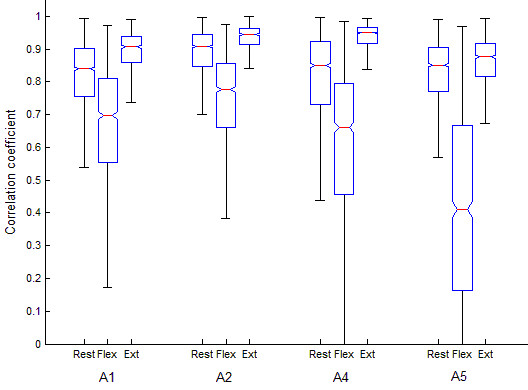
Typical distributions of the zero-lag cross-correlation between the reference (A3) and peripheral sensor locations (A1, A2, A4 and A5) as a function of muscle activation class. Data are shown for participant 4, pooled across all trials.
Official websites use .gov
A
.gov website belongs to an official
government organization in the United States.
Secure .gov websites use HTTPS
A lock (
) or https:// means you've safely
connected to the .gov website. Share sensitive
information only on official, secure websites.
Typical distributions of the zero-lag cross-correlation between the reference (A3) and peripheral sensor locations (A1, A2, A4 and A5) as a function of muscle activation class. Data are shown for participant 4, pooled across all trials.