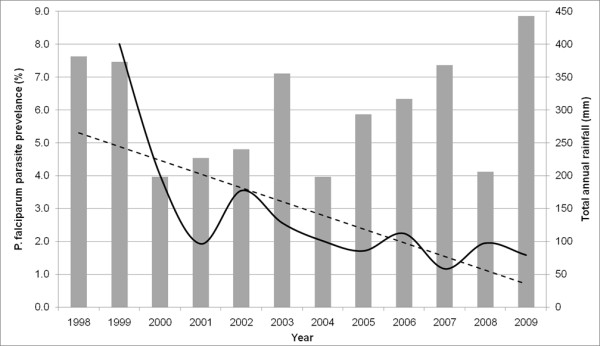
Figure 2.

Graph of P. falciparum prevalence (solid line) and the total rainfall of the preceding year in mm (bars) as estimated from meteorological stations in Gezira state by year of survey. The dashed line represents the linear trend line (R2 = 0.522) of P. falciparum prevalence from 1999-2009.
