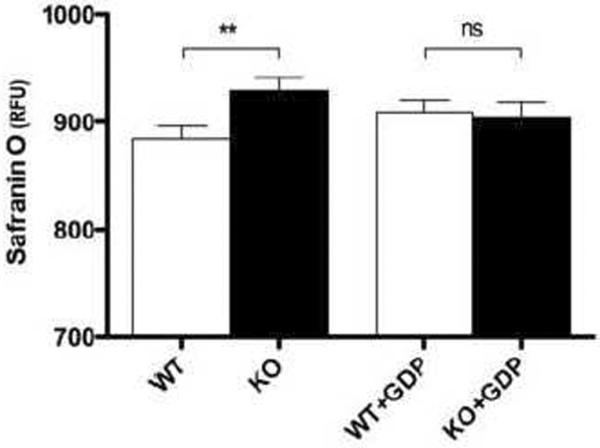
Figure 3. Effect of UCP3 on membrane potential 0–2 min after energization.

The membrane potential was measured in WT and Ucp3KO skeletal muscle mitochondria over the first two min after energization, as described in Materials and Methods. Values are means ± SEM of triplicate experiments performed on 9 separate preparations.
