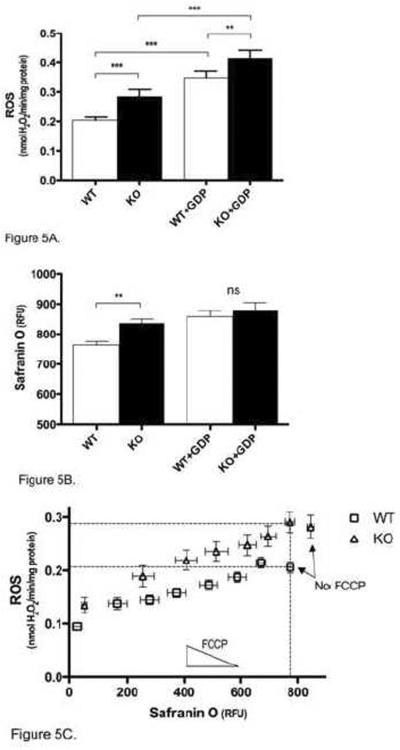
Figure 5. Effect of UCP3 in skeletal muscle mitochondria 8–10 min after energization.
(A) The average rate of ROS production in WT and Ucp3KO mitochondria was measured 8–10 min after energization, with or without 500 μM GDP. (B) The average membrane potential in WT and Ucp3KO mitochondria was measured 8–10 min after energization, with or without 500 μM GDP. (C) Mitochondria from WT and Ucp3KO mice were independently energized with different amounts of FCCP from 0–60 nM. ROS production rates over 8–10 min after energization are plotted against average membrane potential over the same period. Linear and nonlinear regression analysis (Prism) show that the data are best modelled by two different curves (P<0.0001). Dashed lines highlight the ROS production rate and membrane potential for WT mitochondria without FCCP, and for Ucp3KO mitochondria in the presence of 10 nM FCCP. Values are means ± SEM of triplicate experiments performed on 9 (A, B) or 11 (C) separate preparations.

