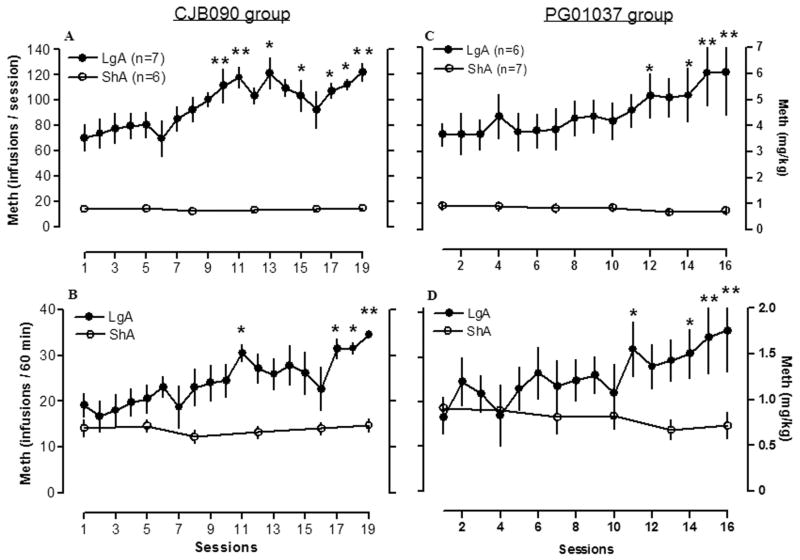
Figure 2. Methamphetamine self-administration under a FR1 schedule by LgA and ShA rats.
Methamphetamine self-administration (0.05 mg/kg/injection) gradually increased over days in rats given extended access to the drug (6h/day daily; LgA, filled circles), whereas methamphetamine intake remained stable over days in rats with limited access to the drug (1h/day every 2–3 days, ShA, opened circles). Left panels (A, B) are data from animals in the D3 partial agonist (CJB090) study, and right panels (C, D) are data from animals in the D3 antagonist (PG01037) study. Top panels (A, C) are data from the entire sessions (6h for LgA rats and 1h for ShA rats), and bottom panels (B, D) are data from the first hour of the sessions. Data are expressed as the mean ± SEM of the number of methamphetamine injections on the left axis and mg/kg on the right axis. *p<0.05, **p<0.01, compared to respective session 1.

