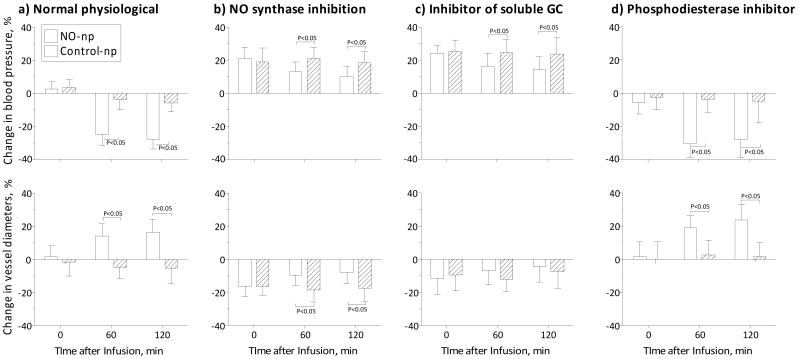
Figure 6. Blood pressure vascular tone effects of NO-np and Control-np mediated by NO synthase (NOS) and guanylate cyclase (GCM) metabolism.
a) Infusion of 10 mg/kg of NO-np (n=5) and Control-np (n=5) during normal physiological condition. Blood pressure (mmHg, mean ± SD) at baseline for each group were NO-np: 112 ± 9 (n=5) and Control-np: 114 ± 8 (n=5). Diameters (μm, mean ± SD) at baseline for each group were NO-np: 62 ± 10 (N=24) and Control-np: 64 ± 12 (N=24). b) Infusion of 10 mg/kg of NO-np (n=5) and Control-np (n=5) during NO synthase inhibition with L-NAME. Blood pressure (mmHg, mean ± SD) at baseline for each group were NO-np: 111 ± 8 (n=5) and Control-np: 110 ± 7 (n=5). Diameters (μm, mean ± SD) at baseline for each group were NO-np: 60 ± 12 (N=22) and Control-np: 65 ± 8 (N=20). c) Infusion of 10 mg/kg of NO-np (n=5) and Control-np (n=5) after ODQ. Blood pressure (mmHg, mean ± SD) at baseline for each group were NO-np: 110 ± 6 (n=5) and Control-np: 112 ± 7 (n=5). Diameters (μm, mean ± SD) at baseline for each group were NO-np: 58 ± 11 (N=26) and Control-np: 62 ± 10 (N=20). d) Infusion of 10 mg/kg of NO-np (n=5) and Control-np (n=5) during phosphodiesterase inhibitor Zaprinast. Blood pressure (mmHg, mean ± SD) at baseline for each group were NO-np: 109 ± 7 (n=5) and Control-np: 112 ± 6 (n=5). Diameters (μm, mean ± SD) at baseline for each group were NO-np: 64 ± 12 (N=20) and Control-np: 66 ± 10 (N=20).

