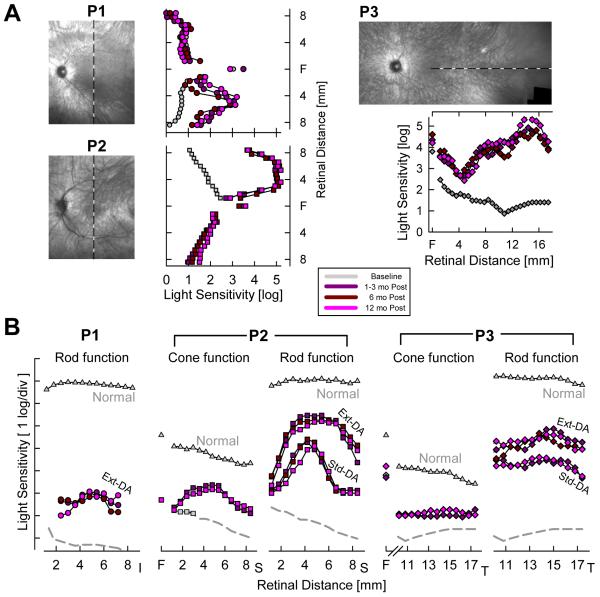
Figure 14.
Visual function improvement in RPE65-LCA patients after gene therapy is stable up to 12 months after treatment. (A) Light sensitivity to achromatic stimuli in study eyes along vertical (P1 and P2) and horizontal (P3) meridians after allowing for an extended (3–8 hr) period of dark adaptation. Sensitivity values recorded post-treatment (colored symbols), are compared with the mean baseline values recorded before treatment (gray symbols). Images of the ocular fundus of the study eyes obtained at 12 months after treatment. All images are shown as left retina for clarity and comparability. F, fovea. (B) Light sensitivity measures with chromatic stimuli support stability of rod and cone photoreceptor-based vision 12 months after treatment in retinal regions of peak response to gene therapy. Rod function measured with blue stimuli after standard (Std) or extended dark adaptation (Ext-DA) conditions. Cone function measured with red stimuli after Ext-DA conditions (at the fovea) or during the cone plateau period in the dark after light adaptation (at extrafoveal locations). The sensitivity axes are shifted vertically to match red and blue stimuli for cone-mediated detection in patients. I, inferior; S, superior; T, temporal retina. Reprinted from Cideciyan et al. 2009a, copyright © by Mary Ann Liebert, Inc..

