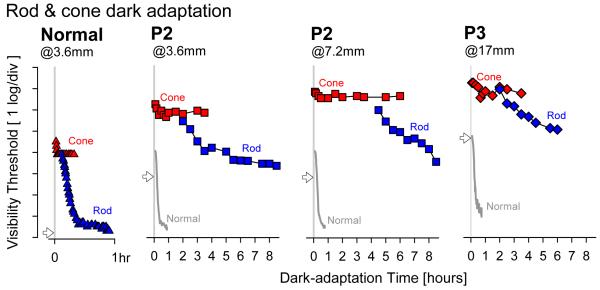
Figure 16.
Dark adaptation kinetics across the retinal region of study eyes in RPE65-LCA patients (P2 and P3) after gene therapy. Rod- and cone-photoreceptor-mediated visual function is measured with chromatic stimuli after a 7 log scot-td.s yellow adapting flash (presented at time 0) in patient 2 (at 3.6 and 7.2 mm inferior loci) and patient 3 (at 17 mm temporal locus). Also shown are detailed results from one normal (N) subject at 3.6 mm inferior (Left) and mean results from normal subjects at each location (gray lines). Cone adaptation kinetics (red symbols) are fast and do not show a difference from healthy cones. Rod adaptation kinetics (blue symbols) are extremely slow compared with healthy rods, and in patient 2 there is evidence for a large intraretinal difference in recovery rate. Additionally, absolute thresholds (arrow along the ordinate) of both rod and cone systems are abnormally elevated. Modified from Cideciyan et al. 2008, copyright © by the National Academy of Sciences.

