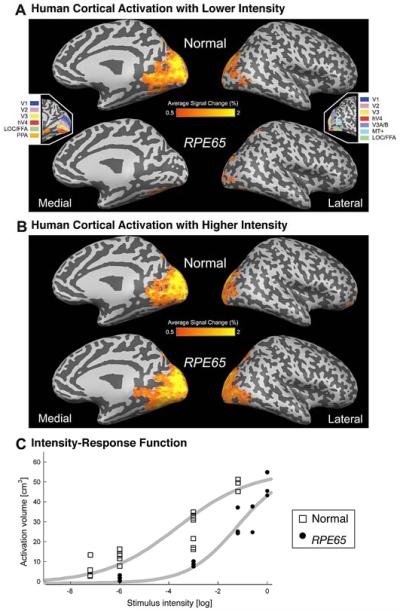
Figure 8.
Mean cortical signal change in response to visual stimulation in human RPE65-LCA (n=6) and normal control populations (n=8). (A and B) The BOLD fMRI response is shown for each population at two stimulus intensities: (A) −3 log and (B) at/near maximum (between −1.2 log and 0 log). The areas of response are displayed upon a digitally inflated right hemisphere. Sulci are indicated in dark gray and gyri in light gray. (Insets) The general position of several retinotopic and higherorder visual areas, derived from data from control participants, is shown. (C) Cortical activation as a function of stimulus luminance is presented. The volume of posterior cortical tissue demonstrating a substantial (>2%) response shows a sigmoidal relationship to the strength of visual stimulation in normal controls and in patients. A Hill function (gray smooth lines) is fit by eye to the data points corresponding to each participant. Reprinted from Aguirre et al., 2007.

