
Fig. 3.
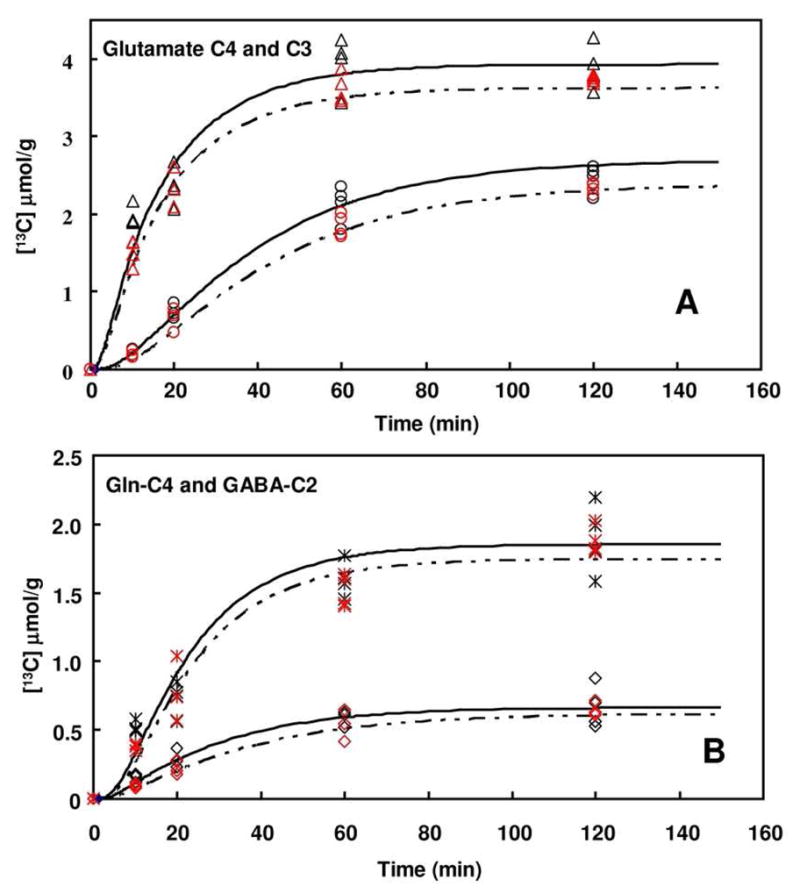
Fit of the metabolic model to experimental data. The time courses of 13C labeling of Glu-C4 (△) and Glu-C3 (○) (A) and Gln-C4 (*) and GABA-C2 (◇) (B) in ST from [1-13C]-glucose are depicted. Note: black: saline; Red: nicotine.
Official websites use .gov
A
.gov website belongs to an official
government organization in the United States.
Secure .gov websites use HTTPS
A lock (
) or https:// means you've safely
connected to the .gov website. Share sensitive
information only on official, secure websites.
Fit of the metabolic model to experimental data. The time courses of 13C labeling of Glu-C4 (△) and Glu-C3 (○) (A) and Gln-C4 (*) and GABA-C2 (◇) (B) in ST from [1-13C]-glucose are depicted. Note: black: saline; Red: nicotine.