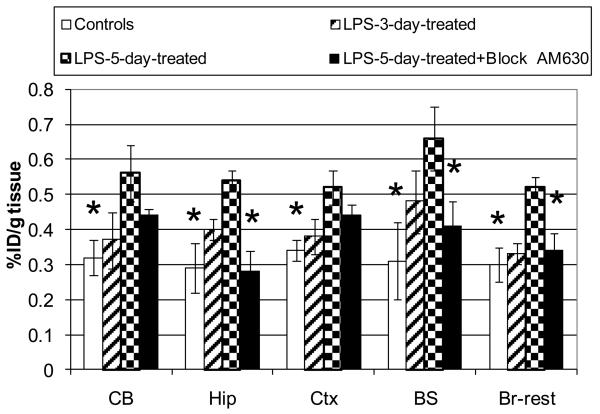
Figure 3.
Comparison of the regional brain distribution of [11C]1 radioactivity (%ID/g tissue±SD, n=3) in control mice and LPS-treated mice. Abbreviators: CB = cerebellum, Hip = hippocampus, Ctx = cortex, BS = brainstem, Br-rest = rest of brain. Group 1: control CD1 mice (Legend = controls); Group 2: CD1 mice were treated with LPS three days before the radioligand study (Legend = LPS-3-day-treated); Group 3: CD1 mice were treated with LPS five days before the radioligand study (Legend = LPS-5-day-treated); Group 4: CD1 mice were treated with LPS five days before the radioligand study and AM630 was injected 30 min prior the radioligand (Legend = LPS-5-day-treated+Block AM630). Radioactivity accumulation in the brain regions of Group 3 is significantly greater than those of Group 1 (all brain regions) or 4 (Hip, BS, Br-rest): *P < 0.05 (ANOVA, single – factor analysis). The data suggests that radioligand [11C]1 specifically binds at cerebral CB2 receptors in the LPS neuroinflammation mouse model (Group 3).

