
Fig. 2.
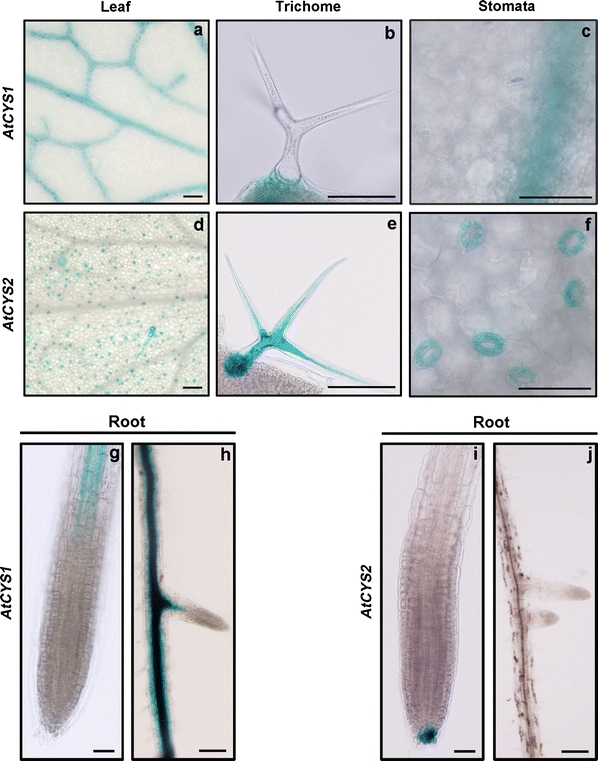
Histochemical localization of AtCYS1P::GUS and AtCYS2P::GUS expression in 10-day-old (gs 1.04) plants. a–f Representative expression patterns in leaf tissues. AtCYS1P::GUS and AtCYS2P::GUS expression in the vascular tissues (a, d), the trichomes (b, e) and the stomata (c, f). Scale bars are 50 μm. g–j Representative expression patterns in root tissues. AtCYS1P::GUS expression in the vascular tissue of the primary (g) and the lateral roots (h). The AtCYS2P::GUS expression in the root caps of the primary roots (i, j). Scale bars are 10 μm in g and i, 50 μm in h and j