Fig. 3.

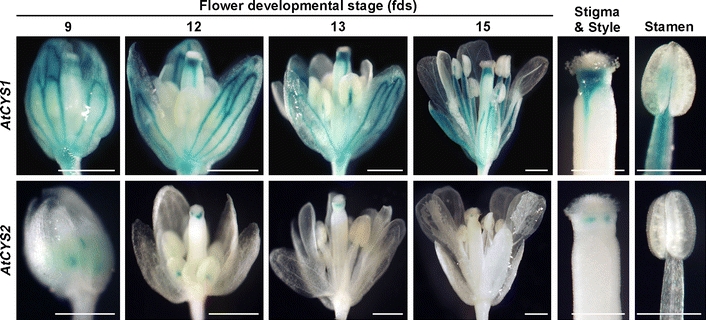
Histochemical localization of AtCYS1P::GUS and AtCYS2P::GUS expression in flowers. The numbers indicate flower development stages (fds). Bars are 500 μm in the main panels and 200 μm in the enlarged images of the carpel and stamen

Histochemical localization of AtCYS1P::GUS and AtCYS2P::GUS expression in flowers. The numbers indicate flower development stages (fds). Bars are 500 μm in the main panels and 200 μm in the enlarged images of the carpel and stamen