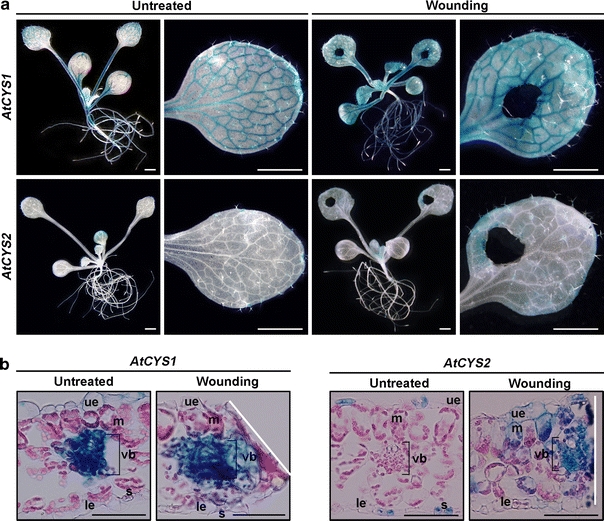
Fig. 7.

Changes in expression of AtCYS1 and AtCYS2 by wounding stress. a GUS expression 48 h after 10-day-old plants was subjected to wounding. Scale bars are 1 mm. b Transverse sections of wounded and control leaves. Scale bars are 50 μm. White lines indicate the wound sites. The abbreviations indicate upper epidermis (ue), mesophyll cells (m), vascular bundle (vb), stoma (s), and lower epidermis (le)
