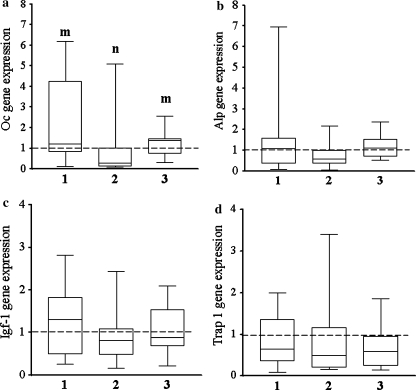
Fig. 4.
Box plot illustrating relative expression levels of a Oc, b alkaline phosphatase (Alp), c Igf-1, d tartrate-resistant acid phosphatase 1 (Trap-1) genes in treatment groups (1) intact vibrated (vib), (2) ovariectomized (Ovx) non-vib, (3) Ovx vib calculated by the 2−ΔΔCT method. Dashed line, expression level in the intact group. Each treatment was conducted with at least nine replications. Medians with different letters differ significantly (P < 0.05, Dunn test)

