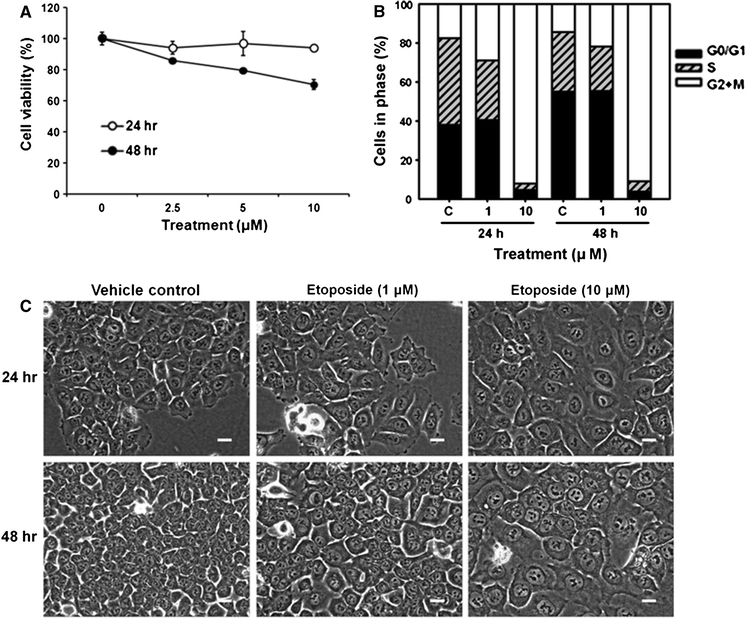
Fig. 2.

Effects of etoposide on viability, cell cycle distribution, and cellular morphology of HCT116 cells. Cells were treated with etoposide (0–10 μM) for 24 or 48 h. a Cell proliferation was determined using the MTT assay. Data are expressed as the mean ± SD of triplicate experiments. ** P < 0.001 and * P < 0.01 compared to vehicle control. Graph is a representative from three independent experiments. b Cell cycle distribution determined by measuring PI-labeled DNA content using flow cytometry. C vehicle control. Graph is a representative from three independent experiments. c Phase contrast microscope images of HCT116 cells (bar = 20 μm). Representative pictures are shown from at least three independent experiments
