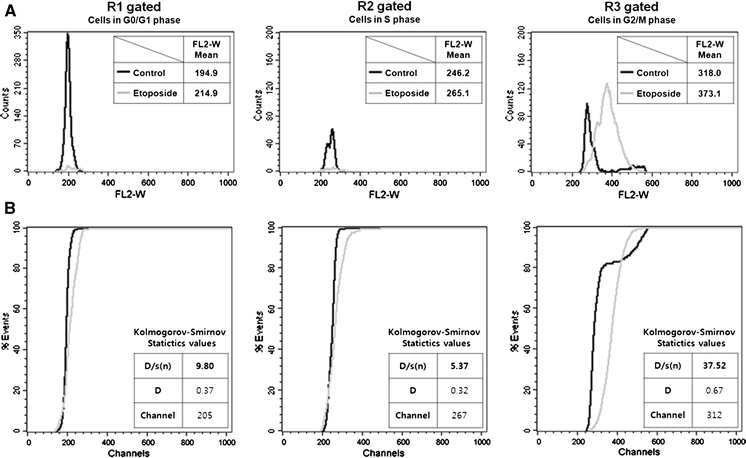
Fig. 5.

Effects of cell cycle phase on etoposide-induced nuclear enlargement. FL2-W distributions were compared between vehicle control and etoposide-treated cells (10 μM, 48 h). Representative data sets are shown from three independent experiments. a Histogram plots of FL2-W, schematized from cells in each cell cycle phase (left: R1 gated, G0/G1 phase cells; middle: R2 gated, S phase cells; right: R3 gated, G2 + M phase cells; explained in Fig. 4). Overlay histograms schematized using vehicle control (dark) and etoposide-treated (gray) cell data. Mean values of FL2-W are represented in each plot. b Kolmogorov–Smirnov statistics were used to quantitatively compare the FL2-W distribution between vehicle control (dark) and etoposide-treated cells (gray) shown in (a). D/s(n), index of similarity for the two curves. If D/s(n) = 0, the curves are identical. D, greatest difference between the two curves. Channel, channel number of D. P values <0.001 for all data, which is the probability of D being as large as it is assuming that the two selected histogram are from the same population. Each value was calculated using the Kolmogorov–Smirnov statistics tool of CellQuest Pro software
