


Fig. 1.
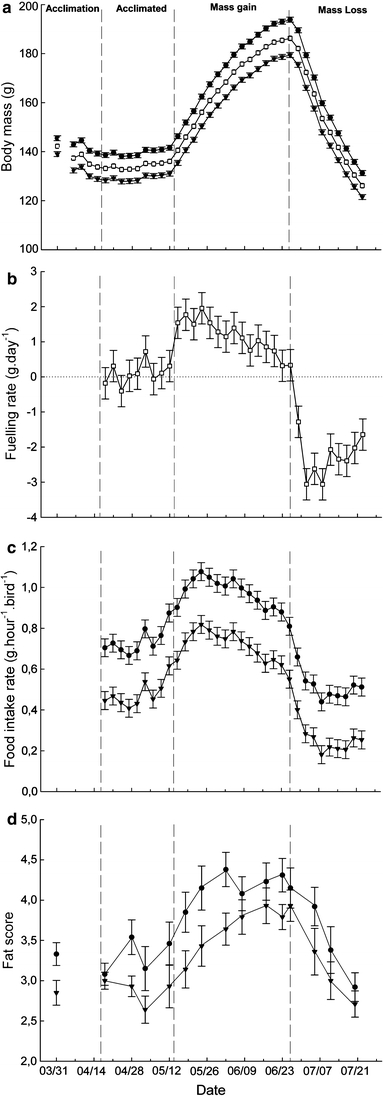
Effect of time on body mass (a), fuelling rate (b), food intake rate (c) and fat score (d). Treatment effect on body mass was marginally non significant (p = 0.08), we therefore show both treatment groups and report the average pooled values that is referred to in the text. Fuelling rate was not affected by thermal treatment (p = 0.9) while food intake rate differed significantly between cold and warm acclimated individuals (p < 0.01). Data on fat score are shown for both treatments as they were separately analyzed non-parametrically. Except for fat score where actual values are reported, data are least square means controlling for the effect of group replicates and individual in a repeated measures ANOVA. See text for details. Cold: black circle; Warm: black triangle; mean: open square