


Fig. 2.
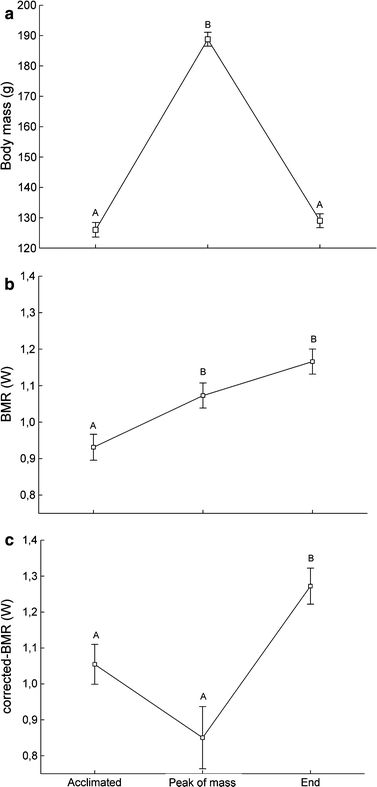
Effect of time on body mass (a), whole (b) and mass-corrected basal metabolic rate (c). Different letters show significant difference between time periods. Body mass effect in c is controlled by adding mass as a covariate in the model. Data are least square means controlling for the effect of group replicates and individual in a repeated measures ANOVA (a, b) and ANCOVA (c)