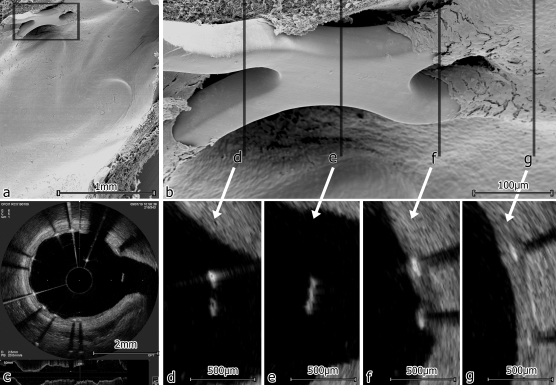
Figure 1.
Representative corresponding images of scanning electron microscopy (SEM) and optical frequency domain imaging (OFDI) analysis of the same stent segment. (A) Overview in SEM; (B) details of the side-branch in SEM; (C) overview in OFDI; (D–G) sequential OFDI images showing covered and uncovered stent struts corresponding to the marked positions in the electron microscopy image in (B); (F) shows one strut covered (upper) and one strut blank (lower) as seen on the SEM image as well.

