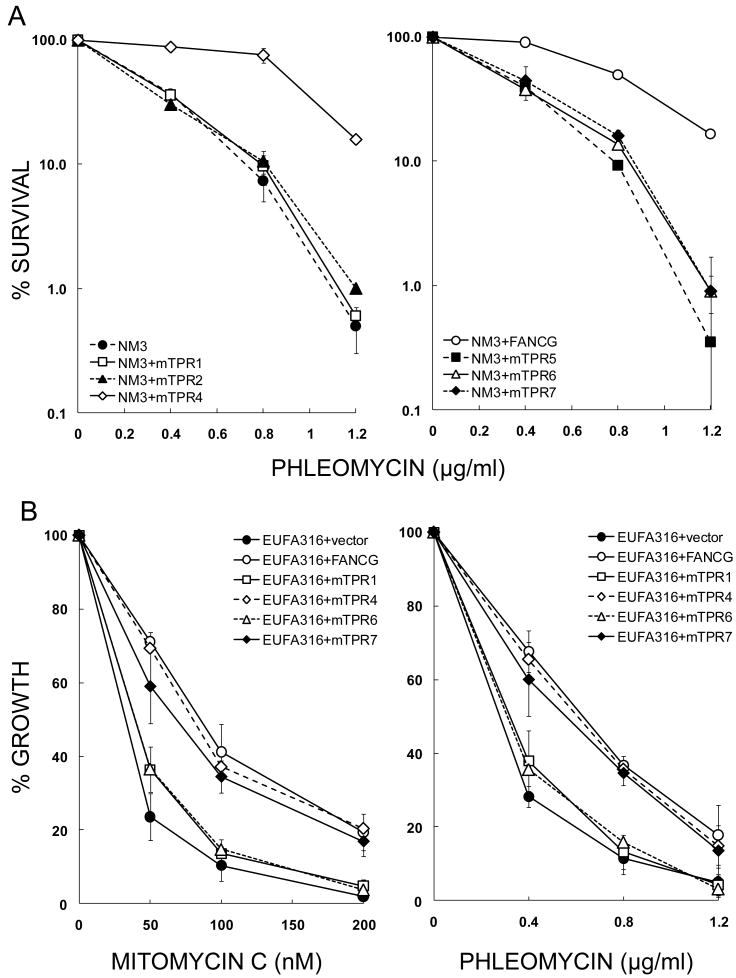
Fig. 4.
Phleomycin survival responses of NM3 and EUFA316 cell lines expressing FANCG with mutated TPR motifs. (A) Clonogenic survival assays were performed for hamster cell lines with curves shown representing the means of 2-4 experiments and error bars showing the standard error of the mean (SEM). The responses of NM3 cell lines with mutated TPR1, TPR2, TPR5, TPR6 and TPR7 (respective D37 values = 3.4, 3.4, 3.4, 3.7 and 4.3 μg/ml phleomycin) were similar to NM3 (D37 = 3.1 μg/ml phleomycin), whilst the response of NM3+mTPR4 (D37 = 8.9 μg/ml phleomycin) was similar to NM3 corrected with wild type FANCG cDNA (D37 = 8.0 μg/ml phleomycin). (B) Growth inhibition by MMC and phleomycin in human EUFA316 (FA-G) cell lines expressing the TPR-mutated forms of FANCG. Exponentially growing cells (106) were plated into 75 cm2 flasks, grown until near-confluence was reached in control cultures, trypsinised and cell numbers determined by haemocytometer. Data shown represents the minimum of 3 independent experiments. The dose of MMC required to inhibit growth by 50% was 23 nM for EUFA316+vector, 40 nM for EUFA316+mTPR1 & EUFA316+mTPR6, 69 nM for EUFA316+mTPR7, 81 nm for EUFA316+mTPR4 and 85 nM for EUFA316+FANCG. Doses of phleomycin reducing growth by 50% were 0.28 μg/ml for EUFA316+vector, 0.31 μg/ml for EUFA316+mTPR6, 0.33 μg/ml for EUFA316+mTPR1, 0.56 μg/ml for EUFA316+mTPR7, 0.61 μg/ml for EUFA316+mTPR4 and 0.63 μg/ml for EUFA316+FANCG.

