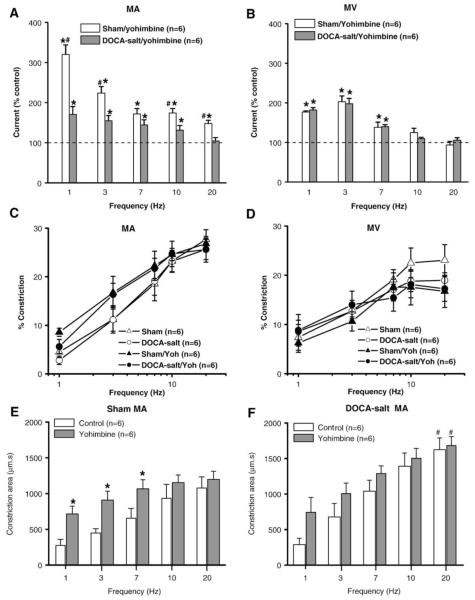
Fig. 3.
Effects of yohimbine on NE oxidation currents and neurogenic constrictions. (A) NE oxidation currents recorded in the presence of yohimbine (1 μM) in sham and DOCA-salt MA. (B) NE oxidation currents recorded in the presence of yohimbine in sham and DOCA-salt MV. Data are expressed as % of the response obtained in each tissue before the application of yohimbine. * Indicates a significant increase over control levels (100%, P< 0.05). # Indicates significantly different from the levels in DOCA-salt MA (P< 0.05). Frequency–response curves for peak neurogenic constrictions in sham and DOCA-salt MA (B) and sham and DOCA-salt MV (D) in the absence and presence of yohimbine. (E) Frequency-dependent increase in the area of neurogenic constrictions in the absence and presence of yohimbine in sham MA. * Indicates significantly different from sham MA in the absence of yohimbine. (F) Frequency-dependent increase in the area of neurogenic constrictions in the absence and presence of yohimbine in DOCA-salt MA. Yohimbine did not change the duration of constrictions in DOCA-salt MA. # Indicates significantly different from constriction area in sham MA at the 20 Hz stimulation. Data are mean ±S.E.M.

