
Figure 1.
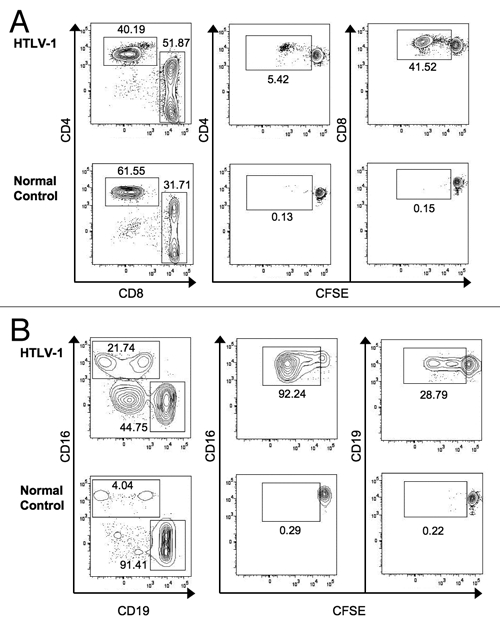
Detection of spontaneous lymphocyte proliferation in T, NK and B cell populations. (A) Cells were first gated to identify single cells that were Aqua-amine reactive dye negative (viable) and CD3+. Gated cells were plotted as CD4 vs. CD8 (left column). Gated CD4+ or CD8+ T cells were plotted vs. CFSE (middle and right columns, respectively), with proliferating cells falling in the CFSElow gate. (B) cells were gated to include viable single cells that were CD3−. Gated cells were plotted as CD16 vs. CD19 (left column). Gated CD16+ NK cells or CD19+ B cells were plotted vs. CFSE (middle and right columns, respectively), with proliferating cells falling in the CFSElow gate. Representative data are shown for HTLV-1 infected (upper rows) and normal control subjects (lower rows).