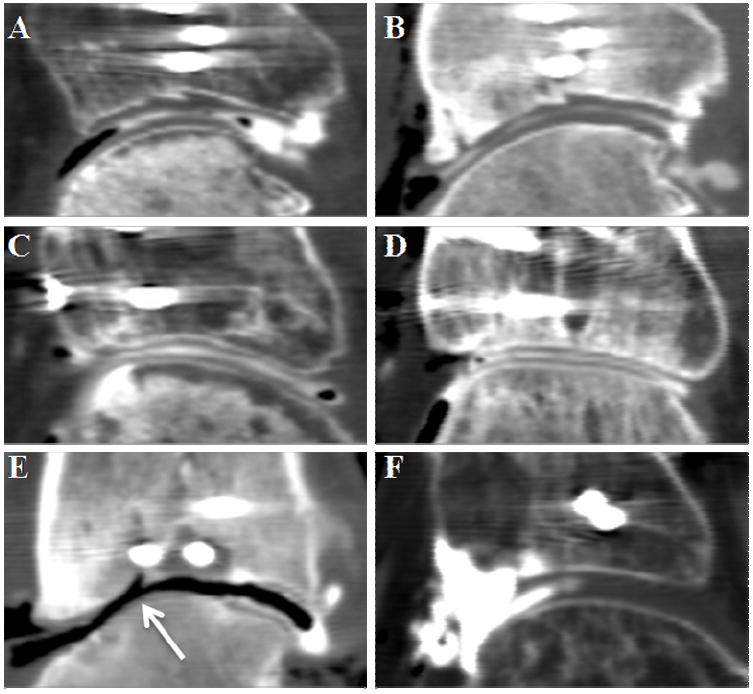
Figure 2.

Sagittal views of representative double-contrast MDCTs are shown. In the top row, cartilage thinning is apparent between (A) early and (B) later scans, particularly in the central region. The middle row illustrates a case that preserved its cartilage between time points (C:4months, and D:24months). Image (E) illustrates a joint with severe thinning and exposed bone near a step-off (arrow). The CT slice in (F) is an example of a failed study. Note the pooling of contrast in the anterior region (left side of image).
