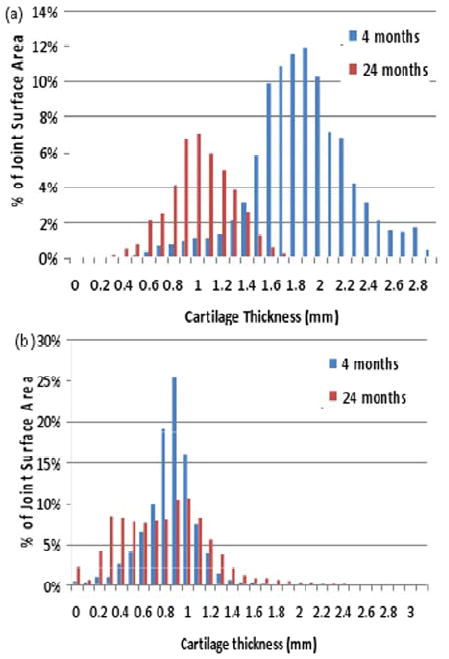
Figure 4.

(a) This representative histogram of the observed cartilage thickness in an ankle joint demonstrates global loss of cartilage thickness from 4 to 24 months. Average cartilage thickness decreased in this particular case from 1.82mm to 0.97mm. This ankle was graded KL 3. (b) The histogram from a second case demonstrates the re-distribution in cartilage thickness from 4 to 24 months. Average cartilage loss in this case was only from 0.80mm to 0.74mm. Cartilage which was globally thin appeared to become more uniform over time. This case was also graded at KL=3.
